Since as long as there has been a stock market, there have been people trying to determine which investments will rise in the future and which will not. The two predominant methods of stock analysis investors use today are fundamental analysis, which tries to determine the value of stocks based on the health and growth of the underlying company, and technical analysis, which attempts to predict future stock price movements based on patterns in historical pricing and volume data.
This site analyzes stocks based entirely on company fundamentals. But does that mean that technical analysis has no merit? Can a reasonable investor make money using technical analysis just like they can using fundamental analysis, or even just buying an index fund and holding long-term? The short answer is that, yes, technical analysts can still turn a profit, but not for the reason you may think.
In this article I challenge the idea that technical analysis can actually be used successfully over the long run by investors to predict future stock price movements.
What qualifies as a technical pattern?
One of the reasons I believe technical analysis to be more astrology than science is because there are a seemingly endless number of “patterns” that purport to have some sort of meaning. In fact, I have been unable to find a definitive inventory or census of all of the technical indicators, and I doubt one actually exists. How is a new technical analyst supposed to draw meaning from an endless array of potential signals, and who decides which indicators are valid and which are not?
Another complicating factor is that patterns can—quite often, in fact—be contradictory. You might see a head-and-shoulders pattern conflict with a Fibonacci retracement and a Bollinger band contraction. Which indicator are you supposed to believe? Technical analysts even disagree about how to interpret the same pattern. In the case of the cup-and-handle indicator, I found one website that argues that “the handle should form over a period of at least five days to several weeks,” suggesting that longer handles are preferred, while another claims that “patterns with shorter handles have a higher success rate than patterns with longer handles.” Once again, which source should you believe?
To explain away this problem, you will often hear technical analysts claim that no one indicator should be used in isolation but rather in combination with other indicators. What you don’t hear them say, however, is which indicators should be used in combination and even which indicators are valid for technical analysis at all. In essence, this statement is a way for technical analysts to downplay the times when the indicators don’t work out as intended. It reminds me of when a friend from a rival university used to tell me, in reference to her university’s football team, “they never lose, they just run out of time.” At a certain point, you just have to admit when your idea was a losing one.
To be fair, fundamental analysis is also not an exact science and does indeed require the integration of multiple different data points and judgments. However, fundamental analysis benefits from the fact that the underlying financials and prospects of a company have a direct impact on the value of the shares, while technical indicators have no actual relationship to the value of the shares. Additionally, it is rare that any company fundamental could possibly be labeled definitively as a “bullish” or “bearish” signal. Rather, in fundamental analysis, the data points have little meaning by themselves and must be considered part of a cohesive whole to determine the value of the company.
Want to find the pattern you are looking for? Change the time interval.
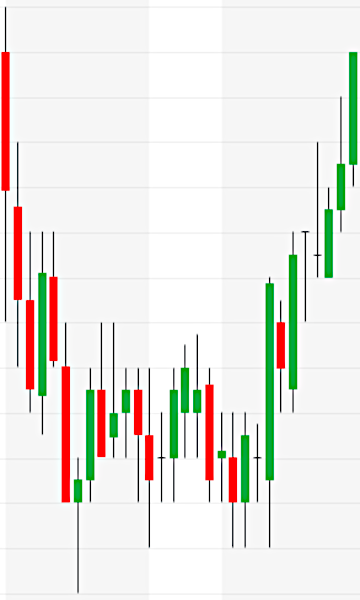
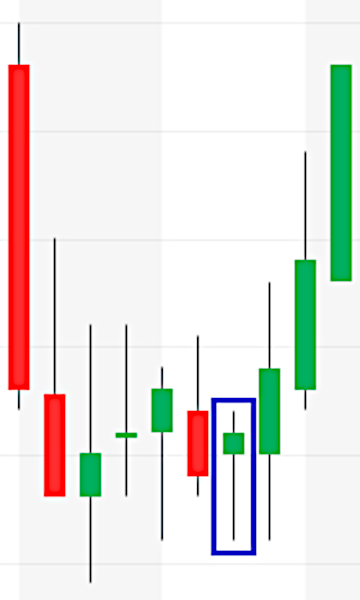
Another key problem I have with technical analysis is that there is no defined time period for any given indicator. For example, a “hammer” in a candlestick price chart is supposed to portend a reversal of a downward trend. Shown below are two candlestick charts of Ford Motor Company (F) from 12:00pm to 2:30pm on March 8, 2023. In the first chart, the interval of each stick is set to 5 minutes. Despite a reversal in trend, no hammer is found. However, if you set the chart interval to 15 minutes per candlestick, the hammer appears. The fact that there is no designated interval for a pattern means that technical analysis is, at best, an extremely inexact science and, at worst, completely worthless.
The entire exercise of finding a technical indicator by shifting the time interval is one that is highly susceptible to confirmation bias. Wikipedia defines confirmation bias as “the tendency to search for, interpret, favor, or recall information in a way that confirms or supports one’s prior beliefs or values.” Accordingly, if you want to find a technical pattern in a stock price movement, given the sheer number of indicators and the various time intervals you can set for the chart, you are virtually guaranteed to find what you are hoping to find.
Trying to find the signal in the noise
Stock prices are extremely noisy. The price of a stock can shift every second while the market is open despite no real change in the underlying value of the company. These price fluctuations are noise. It can sometimes take years before the intrinsic value of the company (the signal) is revealed in its stock price. Technical analysts, by betting on the short-term movements of a stock, are effectively mistaking the noise for a valid signal.
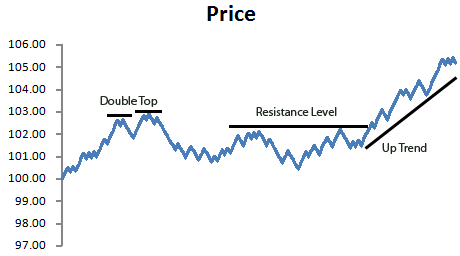
A famous example of this concept was illustrated by Burton Malkiel, the author of A Random Walk Down Wall Street. To demonstrate the folly of technical analysis—or “charting,” as it was often called at the time—Malkiel created a chart by flipping a coin several times in a row. If the coin flip was heads, he would increase the stock price, and whenever the coin flipped tails, he would decrease the stock by the same amount. The random motions created by the coin flips would create a chart similar to below (credit to TVMCalcs.com for the chart):
When Malkiel gave this randomized chart to a technical analyst, the analyst mistook the random noise for a signal and advised Malkiel to buy the fictional stock immediately. This is the type of mistake every analyst makes when confusing the noise for a signal.
The biases that technical analysts never admit to
Another problem with technical analysis is its overwhelming susceptibility to hindsight bias and survivorship bias. Hindsight bias is the tendency for people to overestimate their ability to predict an event after it has already occurred. When a theory turns out to be right (or wrong), people often unconsciously revise their own memories of the past events to make the conclusions seem more predictable than they really were. Relatedly, survivorship bias occurs when analysis of data is limited to only those subjects or entities that have “survived” a particular process or event while ignoring those that did not.
These two biases are highly ingrained in the field of technical analysis. When learning about a technical indicator, you will often see numerous examples of when those technical indicators appeared and how the stock price moved as a result of those indicators. What these guides do not show you are the just-as-frequent of times when a pattern occurred yet the price failed to move as indicated. In fact, when I was trying to find the hammer indicator in the Ford stock chart that I showed above, I saw several hammer candlesticks that did not lead to a trend reversal before I found a single example of one that did.
Lack of quality academic support
Although many technical analysts like to point to various academic studies which purport to demonstrate that technical analysis is a valid way of predicting future price movements, I have yet to see any conclusive evidence. The studies which do claim to demonstrate some statistically significant result cover—at most—only a few indicators, making the entire study vulnerable to “p-hacking” – a form of selection/survivorship bias in which statistical analysis is performed on many data sets, yet only the “statistically significant” ones are reported in the study. Furthermore, as anyone with even a basic level of statistical education can explain, even if a study claims that some indicators show statistical significance, that does not rule out random chance. In fact, I have seen at least one study which considered two indicators “significant” at the p < .10 level, which indicates that there is a 10% chance that the correlation is purely a result of random chance. With such a large number of possible indicators, it is not surprising that two might show some sort of positive correlation completely by chance.
Additionally, the time period for determining whether a technical indicator demonstrated some predictive power is rarely well-defined. For example, when a study claims that a supposedly bullish indicator was shown to have some statistical significance, how do they define it? If a stock briefly shifts upward after a bullish indicator before continuing a long-term downward trend, does the study consider that a confirmation of the indicator or not? These definitions can make a big difference in how a study determines significance, but they make little difference to the ability of technical traders to make a profit.
Rage against the machine
In many ways, technical analysis is a self-fulfilling prophecy. If enough people believe in the validity of certain indicators, it can actually cause those indicators to become somewhat valid. For example, let’s say that a large number of technical analysts believe that when a stock shows a cup-and-handle pattern, it means the stock price is about to rise. Because so many people believe in this pattern, when the pattern shows, people will swoop in to buy shares, which causes the stock price to rise, confirming (supposedly) the pattern. Conversely, if at some point in the future everyone were to stop believing that technical analysis is valid, then the indicators would never work.
Herein lies the problem: even if technical analysis was based in science, the algorithms run by the massive trading companies will beat you to the punch every time. If a pattern suddenly appears supposedly suggesting a near-term rise in price, the algorithms will scoop up the available shares, causing the stock price to rise before you ever get a chance to take advantage of the technical indicator for your own profit. When you then go to buy the stock yourself, you will have to pay a higher price, potentially buying from a trading algorithm that will profit off of you. Thus, even if technical analysis has any merit, the existence of high-frequency trading algorithms will prevent individual traders from profiting from the practice.
Then how do technical analysts still make money?
As long as transaction costs are low, as they are in today’s brokerage climate, a trader making random long trades can still profit from the long-term trend of market increases. Their profits may be more constrained than an actual buy-and-hold investor, but they can profit nonetheless. The reason for their limited profitability is that they have less time exposed to the market. As the saying goes: “Time in the market beats timing the market.” The best strategy is to get in the market and stay there, not to buy and sell frequently over short periods of time. So if you truly want to maximize your profits in the stock market, stick to fundamental analysis and stay away from the technical bulls**t.